Phragmites australis Transcriptome optimal assembly
Multiple types of tissue were used to construct forty-nine P. australis transcriptomes via different assembly tools and multiple parameter settings. The optimal transcriptome for functional annotation and downstream analyses was selected among these transcriptomes by comprehensive assessments. For a total of 422,589 transcripts assembled in this transcriptome, 319,046 transcripts (75.5%) have at least one functional annotation. Within the transcriptome, 1,495 transcripts showing tissue-specific expression pattern, 10,828 putative transcription factors, and 72,165 simple sequence repeats markers were further identified. With this optimal transcriptome and all relative information from downstream analyses, foundations for future studies on the mechanisms underlying the invasiveness of P. australis were laid.
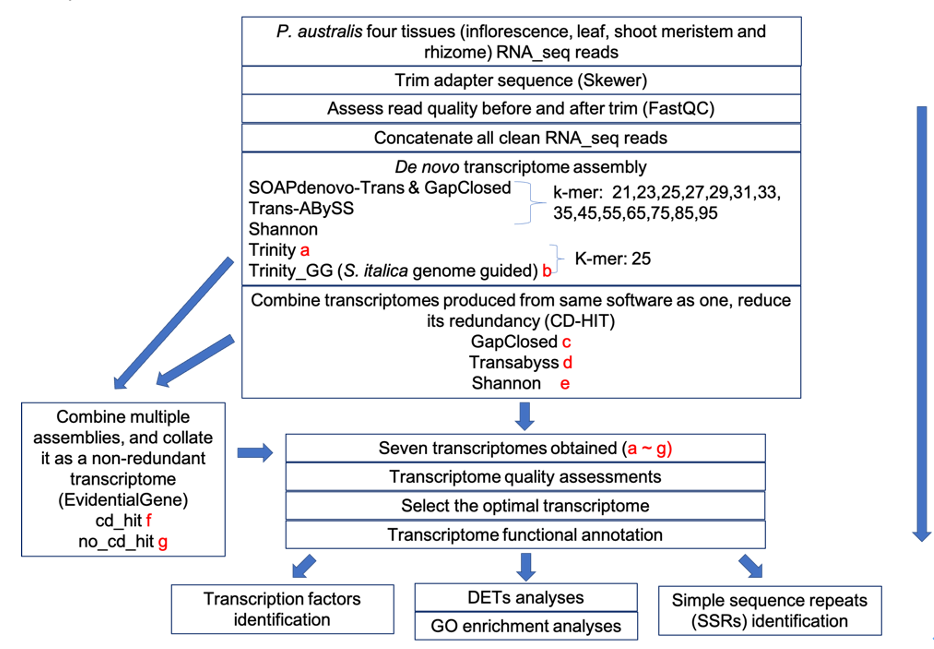
Flowchart:
Script
The scripts performed in this study could be found in this Github site Phragmites-australis-transcriptome-optimal-assembly
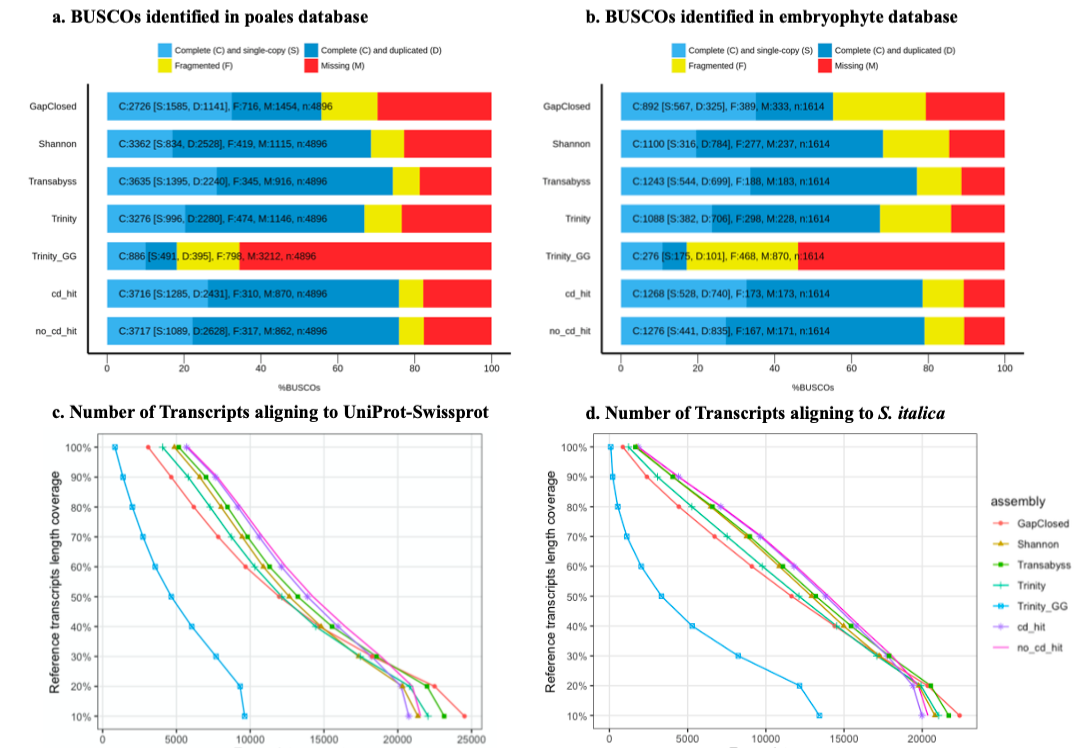
Seven transcritomes from forty-nine assembled transcriptomes for quality assessments
Several assessemnt tools were utilized to select the optimal transcriptome "cd_hit", including BUSCO, count the representation of the aligned protein-coding genes et al.
Transcriptome annotation
TransDecoder was used to extract and predict the likly protein coding regions within transcripts from the transcriptome "cd_hit". Both predicted peptide sequence file "cdhit.fa.transdecoder.pep" and transcriptome file "cdhit.fa" were used for the transcritpome annotation.
The final annotation file was outputted as a CSV file, which is easy for review via using Excel.
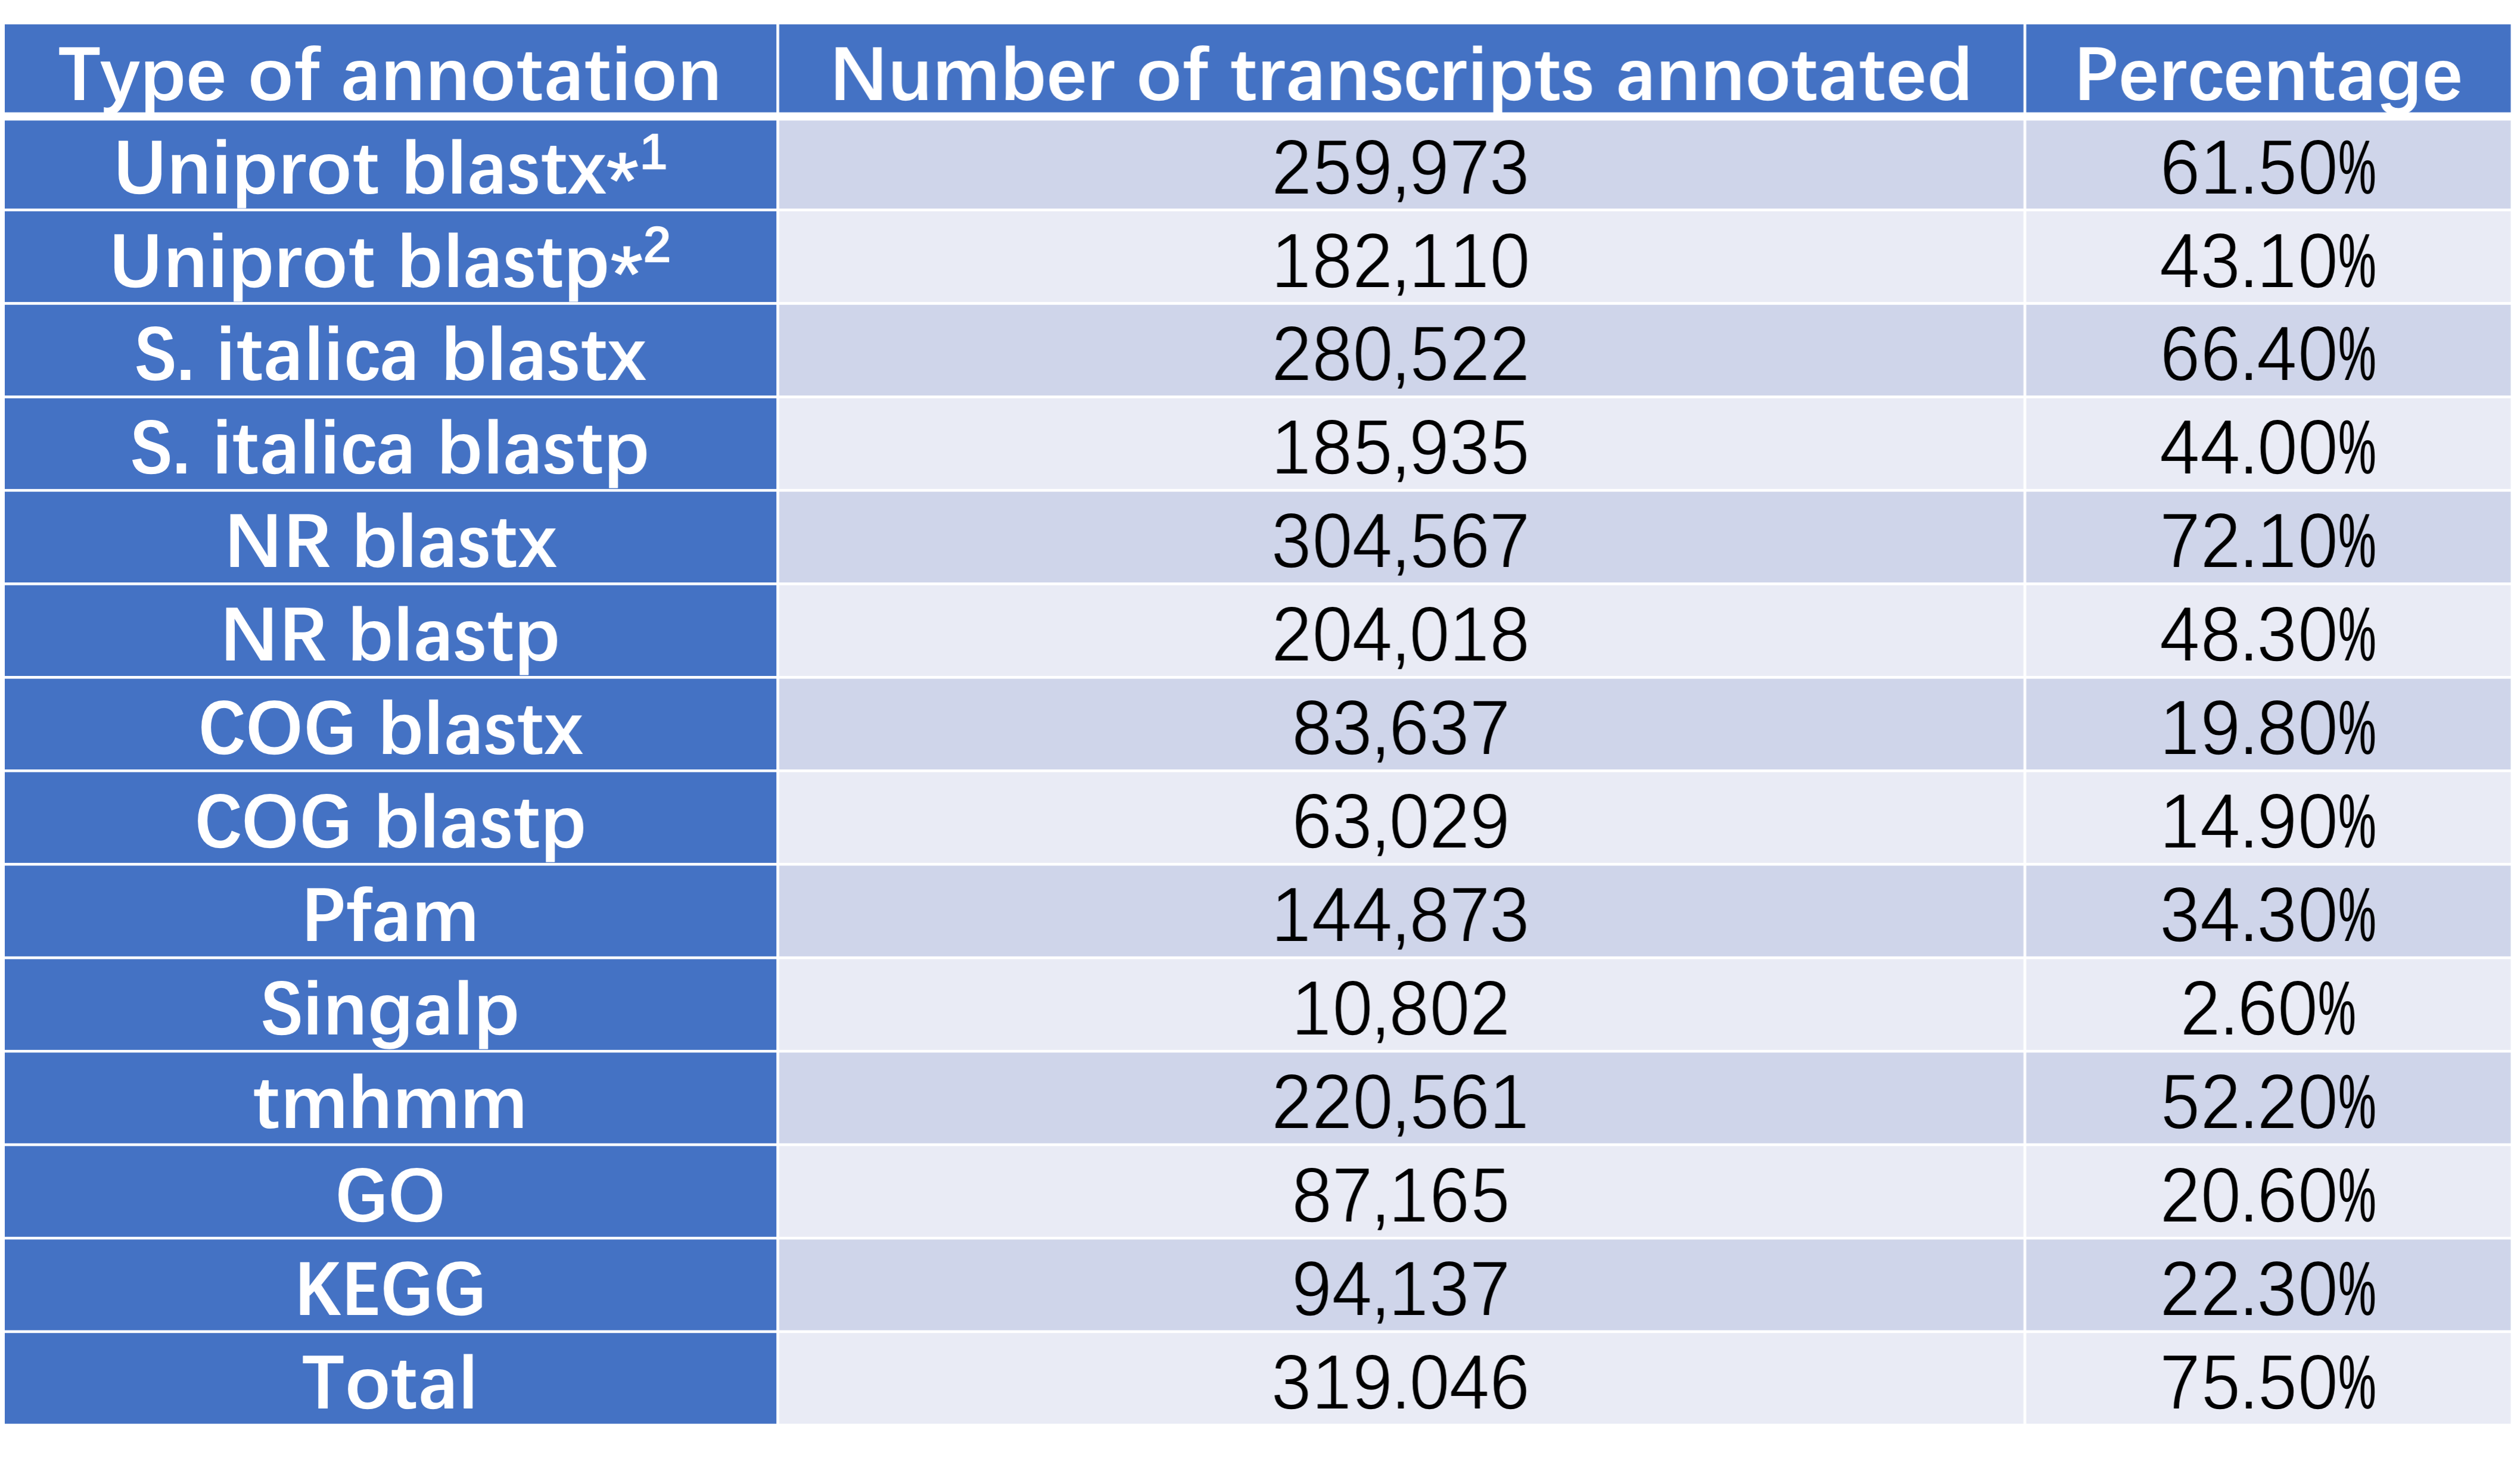
blastx*1 is using transcriptome file and blastp*2 is using predicted peptide sequence file.
Downstream analyses
Three downstream analyses were performed as differential express transcripts(DETs) analyses, transcription factors(TFs) identification and simple sequence repeats(SSRs) identification.
We further used this transcriptomic resource to study the predicted transcripts related to herbicide- and salinity-resistant genes.
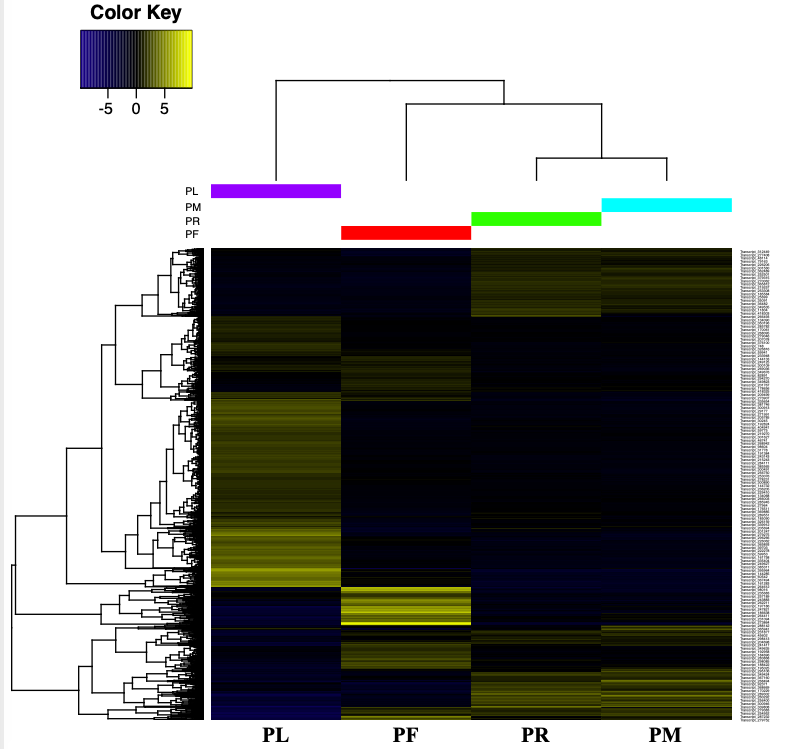
Heatmap of the expressed transcripts in all four tissues.
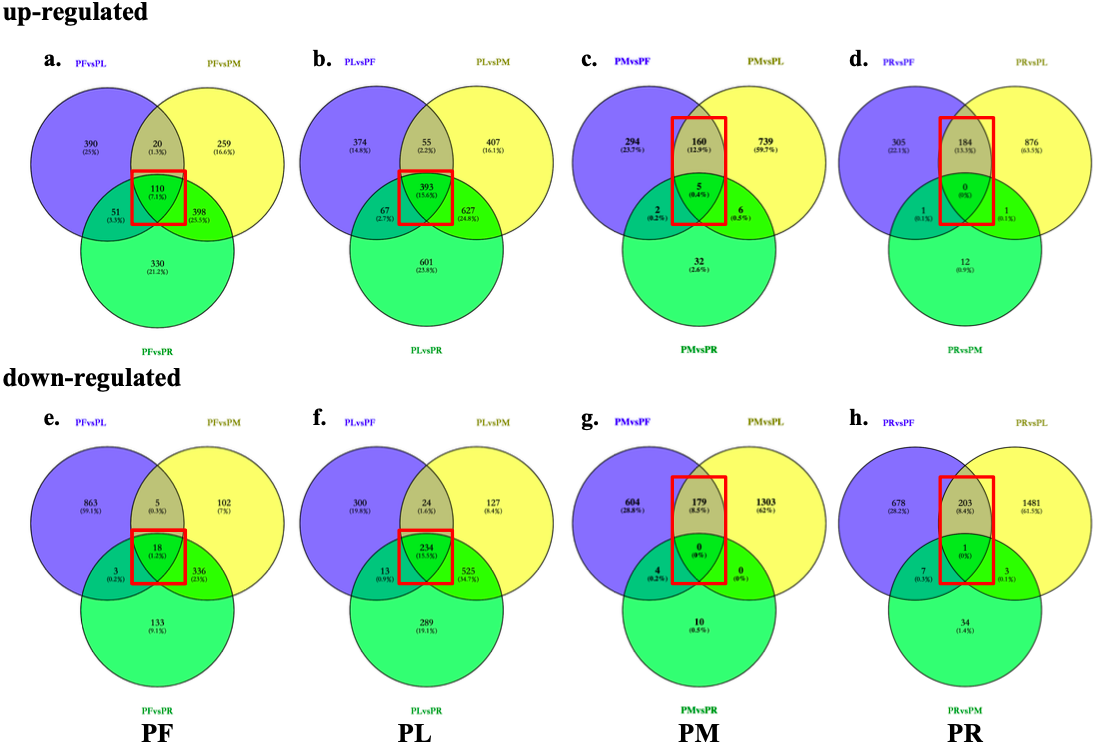
Red boxes indicate the number of tissu-specific DETs from each three pairwise transctripts expression comparisons.